Overview
You may be familiar with the term "line graph" if you are getting ready for the IELTS Writing test in order to study abroad. Knowing how to analyse and present information from a variety of sources is essential for IELTS Academic Writing. The line graph is one typical type of data representation you might come across.
Task 1 of the IELTS A line graph can be used to show comparisons, changes, and trends across time. Acquiring knowledge of the Line Graph is crucial for achieving a high writing band score on the IELTS. But a lot of pupils don't know what a line graph is or how to utilise one. Therefore, in this blog, we will explore everything about the IELTS line graphs and sample responses to help you ace this aspect of the exam.
What is a Line Graph in IELTS?
A line graph, also known as a line chart, is a graphical representation of data over time. It consists of a series of data points connected by straight lines. Each data point represents a specific value, and the lines help visualise the progression or fluctuations in the data over a specified period.
Use of Line Graph in IELTS Writing
Line bar graphs are a common type of visual data representation used in the IELTS Academic Writing Task 1. Test-takers are presented with a line graph that depicts information related to a specific trend, such as changes in temperature, population growth, or economic data. Your task is to analyse the graph and write a descriptive report based on the provided information.
Register Now, for a free Mock test - Join Today!
Structure of the IELTS Academic Writing Line graph
The structure of your IELTS Task 1 line graph typically consists of the following components -
Introduction - Provide a brief overview of the graph's subject, including the timeframe and data sources.
Overview - Summarise the main trends or patterns evident in the line bar graph. Mention the highest and lowest points, significant increases or decreases, and noteworthy observations.
Details and Comparisons - Present specific data points from the graph. Use data accurately to support your observations, and make comparisons where relevant.
Conclusion - Provide a concise summary of the key findings without introducing new information.
How to describe a Line graph in IELTS?
Describing a line graph effectively in IELTS involves the following steps -
Identify Trends - Start by identifying the major trends or changes in the graph. Look for upward or downward slopes, plateaus, spikes, or significant patterns.
Use Data Points - Refer to specific data points on the graph to support your description. Also, mention exact numbers, percentages, or values when applicable.
Vary Your Vocabulary - Utilise a rich and varied vocabulary to describe the data. In addition, use adjectives and adverbs to add nuance to your descriptions. For example, instead of saying "a significant increase," you can say "a substantial rise."
Provide Context - Offer contextual information that helps the reader understand the significance of the data. This could include reasons for the trends or comparisons with other data sets.
Strategies to Score High in IELTS Academic Line Graph
To score high in the IELTS Academic Writing Line Graph task, consider the following strategies:
-
Before you start writing, take your time to thoroughly understand the graph and its key features.
-
Pay attention to the major trends and significant changes. Your overview should capture the essence of the graph.
-
Stick to the information presented in the graph; do not make assumptions or provide personal opinions.
-
Employ a variety of words and phrases to describe trends and changes. This showcases your language skills.
-
Don't repeat the exact phrases from the graph - paraphrase when possible to demonstrate your language versatility.
-
The IELTS Academic Writing Task 1 is time-bound. Allocate sufficient time to each section (introduction, overview, details, and conclusion) to ensure balanced coverage.
Tips to Create IELTS Line Graph
Here are some essential tips for creating a successful IELTS Line Graph response.
-
Familiarise yourself with various line bar graphs for IELTS by practising with sample questions. This practice will build your confidence and improve your analysis skills.
-
Expand your vocabulary related to data representation. Knowing synonyms for standard terms such as "rise," "fall," "peak," and "trough" can be very helpful.
-
IELTS Task 1 Line graphs can depict various data, including trends, comparisons, and combined information. Understand how to approach different types.
-
Carefully review your response for grammar and spelling errors because clear and error-free writing is essential.
-
If possible, have someone with strong English language skills review your practice responses and provide feedback.
IELTS Line Graph Samples
Now, let's explore some IELTS Line Graph samples to see these strategies and tips in action.
IELTS Line Graph Question
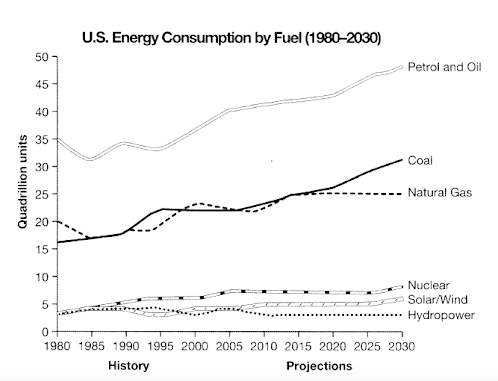
The graph below gives information from a 2008 report about the consumption of energy in the USA since 1980 with projections until 2030. Summarise the information by selecting and reporting the main features and make comparisons where relevant. Write at least 150 words.
IELTS Line Graph Response
The aforementioned line graphs showcase data extracted from a 2008 report detailing energy consumption trends in the USA from 1980, extending to projected figures up to 2030.
As an overview, it can be stated that there has been a consistent increase in the consumption of fossil fuels from the initiation of the period. Projections indicate a further dependence on these fuel sources. Conversely, cleaner energy sources have accounted for significantly less consumption, and forecasts anticipate a continuation of this pattern.
Within the realm of fossil fuels, including coal, natural gas, petrol, and oil, their energy consumption has shown consistent growth since 1980. Commencing at 35 quadrillion units in 1980, petrol and oil experienced fluctuations until 2000. Subsequently, they exhibited a stable and consistent increase, with a projected consumption surpassing 45 quadrillion units by 2030. Likewise, coal demonstrated a similar upward trend, with estimates indicating it will surpass 30 quadrillion units by 2030. Natural gas usage is expected to plateau at approximately 24 quadrillion units from 2020 onwards.
Conversely, at the onset of the period, cleaner energy sources began with consumption levels below 5 quadrillion units and showcased a decrease in their usage, except for nuclear power, which saw a slight uptick to 6 quadrillion units in 2005. Predictions anticipate a modest increase in the use of solar/wind energy. Moreover, hydropower is foreseen to sustain relatively constant consumption levels until 2030."
Conclusion
Mastering the IELTS Task 1 Line Graph requires a combination of understanding data visualisation, vocabulary, and effective writing strategies. By practising regularly, improving your vocabulary, and adhering to the recommended structure, you can confidently tackle this part of the IELTS exam. Success in the IELTS Line Graph task boosts your Writing band score and enhances your ability to analyse and present data effectively.
We hope you are now aware of the Line Bar Graph and how to create it for writing tasks. However, you can contact Prepare IELTS Exam (PI) expert counsellors for further guidance. Our team of education experts is dedicated to providing you with the best guidance in the IELTS exam. You can get a one-on-one counselling session online via our platform. Contact us at info@prepareieltsexam.com or call us at +91 9773398388.
FAQs
No, IELTS may also include other types of visual data representation, such as bar charts, pie charts, and tables. It is essential to be prepared for a variety of data formats.
Your response should be at least 150 words. It is important to strike a balance between providing sufficient detail and adhering to the time limit.
It's better to use full sentences and paragraphs in your response. This format allows you to provide a structured and coherent explanation of the data. Bullet points or lists are generally not recommended.

Latest Blogs
-

IELTS Score for Canada: Minimum IELTS Requirement for Canada 2025
2024-09-27 18:24:14
-

IELTS Apology Letter for General Training: IELTS Writing Task 1
2024-09-25 16:38:03
-

Minimum IELTS Score for Australia: Student Visas, Universities, and PR in Australia
2024-09-23 18:09:51
-

Common IELTS Speaking Topics with Answers
2024-09-20 18:21:56
-

Describe a foreign culture that you like: IELTS speaking cue card
2024-09-18 16:14:11
-

Describe a Rainy Day IELTS Speaking cue card
2024-09-18 11:11:32
-

Describe a new law you would like to introduce in your country IELTS cue card
2024-09-13 17:17:46
-

Describe your favourite weather: IELTS cue card
2024-09-11 18:01:28
-

Describe an enjoyable journey by public transport: IELTS cue card
2024-09-09 18:05:45
-

Step-by-Step Guide to IELTS Registration in India for the Year 2024 & 2025
2024-09-07 12:59:51